


Have you ever looked at the stomach contents of a shark and wondered “What has this shark been eating?” Yes, you could sit there and sort through the contents and hope that there’s enough of the “leftovers” to identify them. But did you know that scientists can also learn a good bit about sharks eating habits without having to sort through the stomach contents? In fact, from this alternative method the shark or other marine organism can even swim away afterwards. It’s called stable isotope analysis and it’s the topic for our latest Tool Talk.
To begin, let’s start with the definition of an isotope; it is an atom that contains the same number of protons in its nuclei but a different number of neutrons. Isotopes can either be stable or unstable, the latter of which are often referred to as radioactive isotopes. For example, radiocarbon dating or C-14 is a measure of decay over time and is used to date historic artifacts or fossils. On the other hand, stable isotopes are used in biological studies and these isotopes, as the name suggests, remain stable over time. There are over 300 stable isotopes with the most common ones used for analyses being carbon (C), nitrogen (N), hydrogen (H) and oxygen (O). Because these isotopes have a slightly different molecular weight, they are able to be measured in chemical reactions by the rate at which they react. Heavier isotopes will react at a slower rate than lighter isotopes which leads to isotopic separation or fractionation of the reaction products.
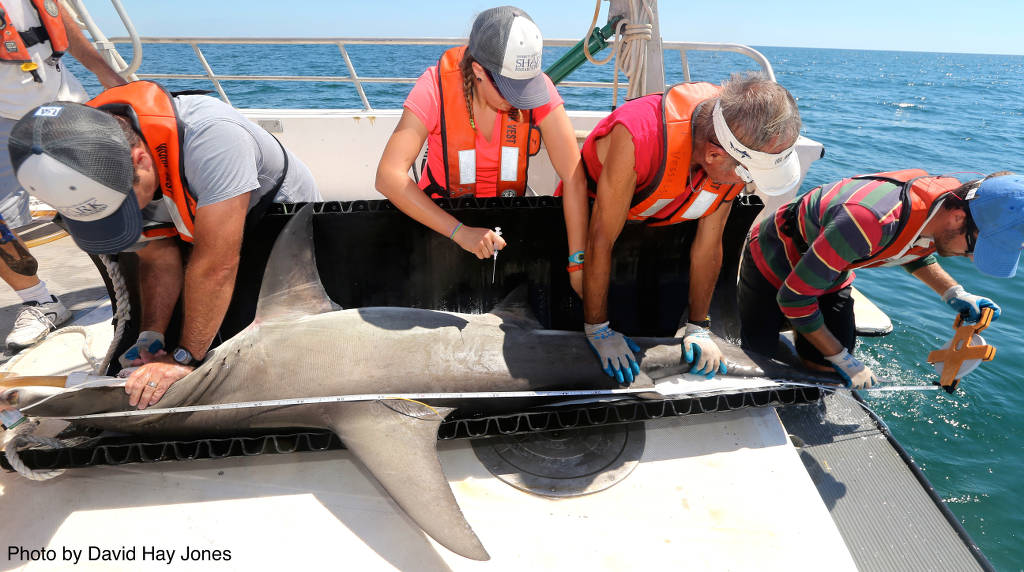
Now let’s discuss how scientists perform this analysis. First, a tissue sample of the species being studied is collected. In the case of our shark example white muscle or dermal tissue would be collected. The sample will then be washed, dried and ground to a fine powder. The muscle tissue sample will then be packed into a tin capsule before undergoing isotope-ratio mass spectrometry (IRMS). If you need a refresher on mass spectrometry, check out our blog post here. The stable isotope abundances, which are the products of the IRMS, are given in delta (δ) values as a ratio. So for the isotope 13C the ratio would be 13C:12C.
Another important factor of stable isotope analysis is the turnover rate or the period of time it takes for an organism’s tissue to reflect a new dietary source. The rate of turnover depends on the type of tissue sampled as well as the body size, growth rate and several other factors. Metabolically active tissues like the liver or blood will have a higher turnover rate than less active tissues like muscle or bone. Often multiple types of tissues are sampled, which provides short term as well as long term changes in an organism’s diet.
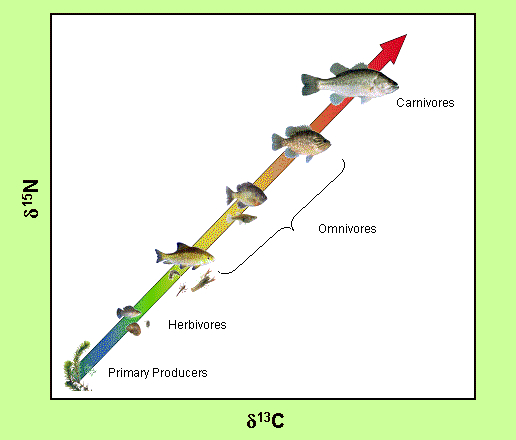
If you remember back to our post on Food Webs, we mentioned stable isotope analysis as a method to construct food webs and determine a species trophic level. The stable isotopes of carbon and nitrogen are the two most common isotopes used for this type of analysis. Carbon isotope ratios are used to infer the source of primary productivity, foraging strategy and feeding location while nitrogen isotope ratios infer the relative position of a species within the food web or its trophic position. Stable isotope analysis can also be used to study many other aspects of an organism’s life including habitat use, migration, population connectivity and their physiology.
ACER researchers are using stable isotope analysis to reconstruct the food webs of oiled and non-oiled coastal waters following the DwH oil spill. Specifically, they are collecting blood and muscle tissue samples from mid-level and higher order consumers, like sharks, to find out if there was any effect of the oil on the consumer population. As carbon isotope ratios can indicate if the shark was feeding in coastal waters verses offshore waters, one of the questions this analysis may help answer is if these consumers were able to avoid the oiled waters. To learn more about the consumer group check out their research page and their Factsheet.
©2015 Dauphin Island Sea Lab