


Despite media reports immediately after the oil spill, the entire northern Gulf coast was not coated in oil. Some areas received heavy oiling, while others received little or no oil cover. In trying to assess the impacts of oil on coastal habitats, scientists need to know which areas were oiled. How do they know this? The answer is a SCAT map.
SCAT is an acronym for Shoreline Cleanup and Assessment Technique. A SCAT map indicates the degree of oiling experienced by a geographic location. As you may recall, one of the major areas of field studies for ACER scientists is the Chandeleur Islands. Below is a SCAT map of the Chandeleur Islands area. The colored lines indicate the degree of oiling. In this figure we have enlarged the map from the website, https://gomex.erma.noaa.gov/, to focus on the Chandeleur Islands. As you can see in the figure, areas experienced different levels of oiling. You might ask, how did they determine this level of oiling? What data did they use? How was it collected?
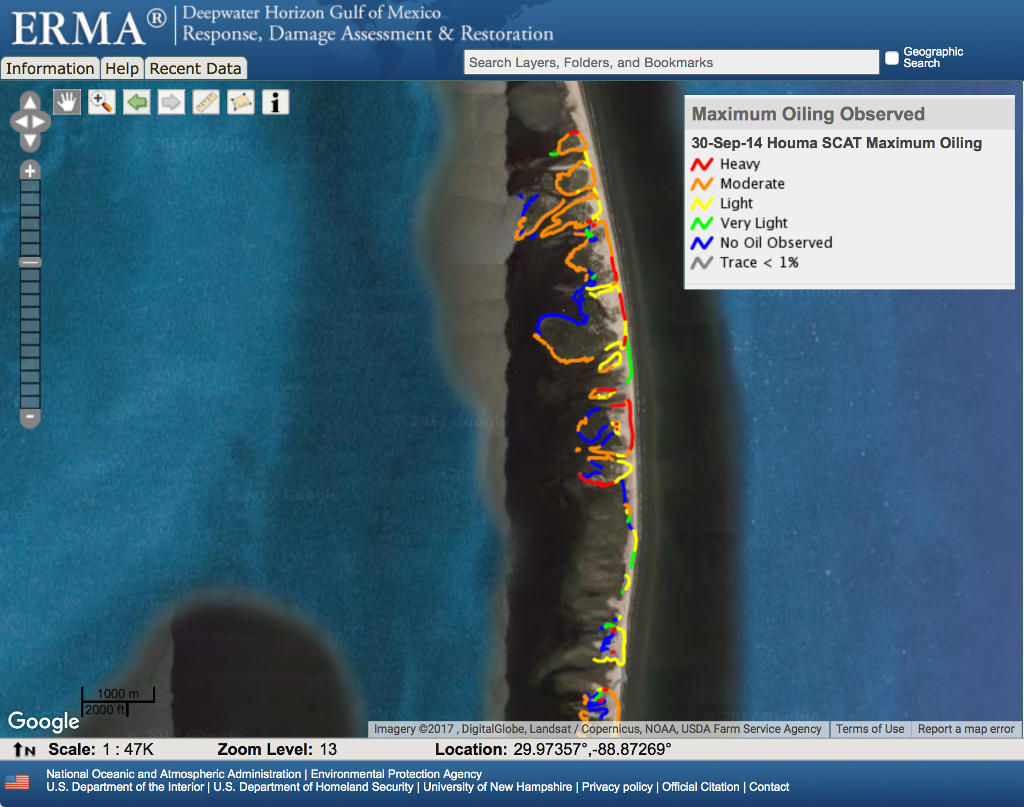
The SCAT technique originated after the Exxon Valdez oil spill in 1989 in Prince William Sound, Alaska. It provided a standardized way to categorize the level of oiling, the type of oil observed, the type of habitat and additional information that allowed response personnel to develop recommendations for cleanup techniques and efforts. Since that time, and multiple spills later, the SCAT technique has become a well-established and more fully developed part of the government response to an oil spill. For those interested, you can find the SCAT manual online at NOAA’s Office of Response and Restoration website.
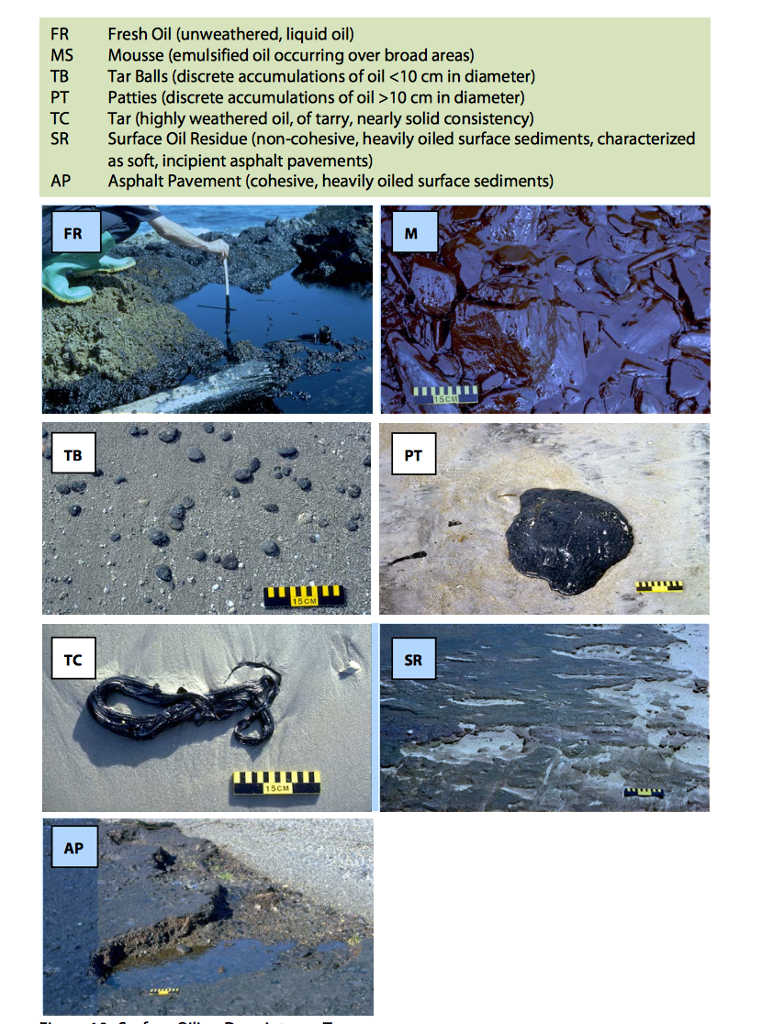
Through a survey of shorelines, SCAT teams determine the type of oil present (for example, liquid, mousse or tar patties and its condition-fresh or heavily weathered). They assess the degree of coverage (ranging from 100% or <1%), the type of shoreline sediment (ranging from boulders to mud), significant coastal processes (for example a coastline that experiences high wave action from one that is heavily sheltered) and identify any ecological, cultural or economic concerns. For large spills such as the Deepwater Horizon event, surveys are conducted using aerial imagery coupled with ‘ground-truthing’ that is visiting locations in person to confirm reliability of the data. Using these data, they then decide on the best course of response, from no clean up to intensive cleaning. They also determine the most appropriate cleanup technique to use and the desired endpoint. Lastly, SCAT teams monitor the effectiveness of the cleanup and decide when it is complete.
The Exxon Valdez oil spill demonstrated that it was possible to cause additional damage by cleaning techniques. In that spill, high-pressure hoses sprayed hot water on the rocky shores further damaging the sensitive intertidal community. In the Gulf Coats region, we have learned that under some conditions, some coastal marshes are better left undisturbed as the mechanical or manual cleaning will damage the marsh grass root network, likely increasing the time to recovery. However, in some areas, clean up is essential as there is potential for human exposure or leaving oil in place will increase the likelihood of it entering coastal food webs resulting in contaminated seafood. A SCAT team will consider these factors before making their response recommendations.
While the SCAT process has been applied to spills of many sizes, the response to the Deepwater Horizon oil spill was unprecedented. Between the spill (April 2010) and January of 2013, the SCAT effort involved over 7,000 SCAT team-days and 7058 unique km (4386 miles) and more than 31,00 kilometers (greater than 19,250 miles) were surveyed (many areas were surveyed multiple times over the course of the response)1. For the unique shoreline distance, 1773 km (1101 miles), or about 25% showed evidence of having been oiled. Beaches accounted for almost 51% of this total, marshes accounted for 45%, with the rest being primarily manmade shorelines. Geographically, the majority of shoreline oiling was documented in Louisiana (61%), followed by Florida (16%), Mississippi (15%) and Alabama (9%).
Interesting, after an initial assessment, the Chandeleur Islands, the focus of ACER’s research, were removed from the Shoreline Cleanup Completion Plan as Refuge staff decided to minimize any further disturbance to this “highly sensitive and difficult to access location”1.
[1] Michel, J. et al. 2013. Extent and degree of shoreline oiling: Deepwater Horizon oil spill, Gulf of Mexico, USA. PLOS One: 8(6): e65087.
©2015 Dauphin Island Sea Lab